A “WAY” FORWARD: How we streamlined power grid data collection with OpenStreetMap
As described in a previous post, our lab undertook a power grid network data acquisition and training project in Indonesia. This data was to be fed into NetworkPlanner to create a broad electrification plan. A potential by-product of this effort would be a system to maintain and update grid data for PLN, the Indonesian electric utility company.
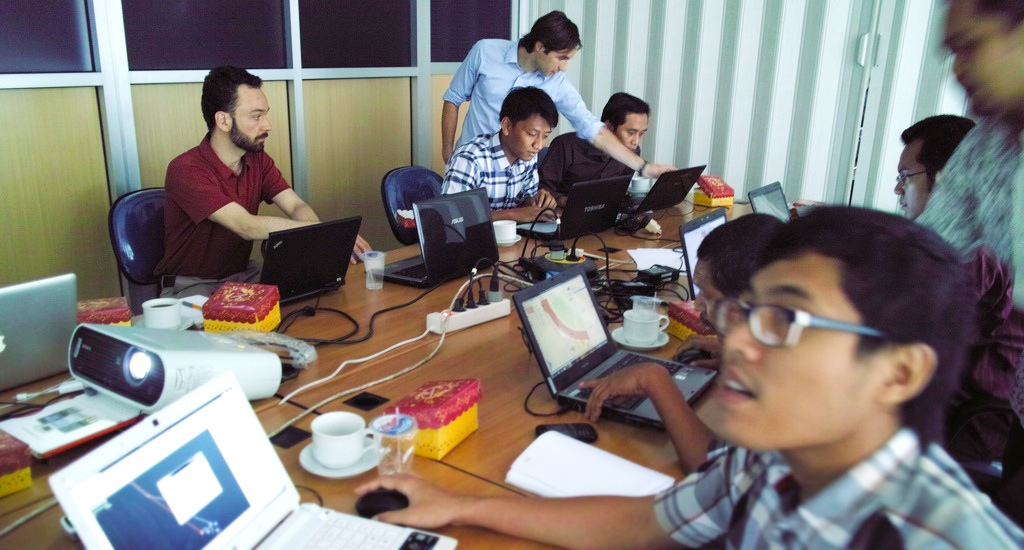
The opportunity was presented to us a few months ago and while the initial timeline was really short (2 days!), we jumped at the chance to help on such an important project and hone our data collection skills in the process.
Requirements
To provide some context, it helps to understand that NetworkPlanner takes supply and demand data as input and generates a cost optimized plan for meeting that demand. Demand data is in the form of locations (x, y coordinates) with attributes such as population. These represent the consumers to supply. Supply data is in the form of interconnected segments, representing the existing network from which to extend in order to connect new consumers. Our primary objective was to capture this supply data (existing network segments) in sufficient detail to generate an accurate electrification plan.
A secondary objective was to capture detail regarding nodes along this network that were important to PLN. These nodes represented power grid equipment such as generators, transformers and safety devices.
A First Pass
Since our initial timeline was short, we needed to make use of existing systems. For collecting the power equipment nodes along the network, the combination of our own
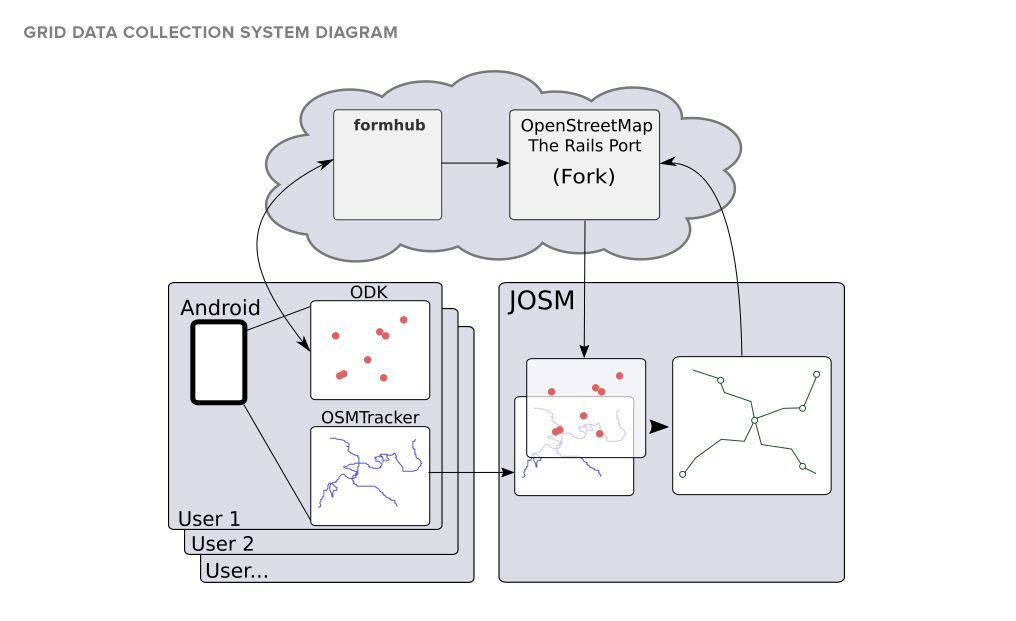
FormHub system and ODK Collect were well suited. FormHub provides hosted services for managing survey forms and associated data. ODK would run on users Android devices and allow them to fill out survery forms (regarding power equipment data) and submit to FormHub.
To capture the network segments we settled on using a GPS tracking application called OSMTracker due to its simplicity. OSMTracker would also run on users Android devices, primarily in the background. It works by capturing latitude and longitude at regular intervals while traveling along a route. This results in an ordered set of points representing a set of connected segments, or in our case, a branch of a power network.
In theory, this was all we needed to meet our objectives. How hard could it be to stitch the points from FormHub and lines from OSMTracker together into a seamless network?
Actually…
It was quite cumbersome. For the network line data, what we were capturing could have been mistaken for a plate of
Cartographic Spaghetti spread out over a set of files. We were able to piece together the line segments from these files into an adequate network as input for NetworkPlanner, but the process was haphazard and laborious.
Further, we had no method for integrating the power equipment node data collected via FormHub and the network line data. An integrated dataset would be much more meaningful to PLN.
Filling the void
At this point, it was obvious that a more centralized and integrated system for capturing geometry would help. Several of us in the lab had positive experiences working with OpenStreetMap for transportation networks. Would it work as well for a power network?
It’s impossible to do it justice in this post, but OSM relies on a topological data model abstracted as Nodes (Points), Ways (which reference Nodes) and Relations (which reference Nodes, Ways or other Relations). Nodes are the fundamental unit of composition, which dramatically simplifies maintaining the integrity of geometry vs managing independent files of points and lines. For instance, a power line and the transformers connected to it would be related inherently by the fact that the Way representing the power line includes the Nodes representing the transformers.
Additionally, OSM data is versioned, so the history of data is retained, a nice safety-net and audit trail. And with practical, efficient user interfaces like JOSM and the new iD editor to manipulate the geometry and interact with the OSM repository, our job seemed almost done.
Or so we thought…
After extolling the virtues of OpenStreetMap and it’s topological elegance we were brought back to Earth to solve two remaining issues:
- We could use OSM tools to capture the power equipment nodes and associated attributes, but it was simpler to teach and use FormHub for this aspect of the effort.
- Data that goes into OSM is bound by the Open Database License. That basically meant we would need to convince PLN to publicize their data from the start. And even if we did, we still could not load much of the existing grid data we acquired from other sources due to license incompatibility.
To resolve #1 we decided to keep the training and usage simple and continue to use FormHub. This necessitated a synchronization scheme between FormHub and our OpenStreetMap solution.
The one obvious solution to #2 was to deploy our own instance (known as a Fork) of the OpenStreetMap server and database (called the Rails Port). This would not be a straight-forward option. It would not only require us to maintain this fork, but we wouldn’t reap all the benefits of the continuous improvements being made by the OpenStreetMap community. In the end, we decided that a fork was the best way forward given the flexibility it granted us. It would also give us a chance to understand the system in more depth to better leverage it and contribute back in the future.
Frankenstein or Goldilocks?
As a 2nd round of on-site training and data capture was quickly approaching, our system was evolving into something that might have been perceived as a Frankenstein. We were attempting to package 2 complex systems (FormHub and OpenStreetMap), each with their own set of tools and methodologies into a single comprehensive system for this project.
Given our time constraints, the requirements and our existing tools, we prefer to think that our system evolved via the Goldilocks Principle. With enough architecture and design to provide structure and make data capture efficient, but not so much as to be impractical or introduce delays in the project…i.e. “just right”.
Execution
Once we had a working system, our execution strategy resembled Fire and Motion. To summarize, we focused on incremental progress in a “damn the torpedoes” style. To solve synchronization, we wrote a script to diff the FormHub data with a “synchronization db” and push the new data into our OpenStreetMap instance. We tailored our FormHub forms to be more consistent with the OpenStreetMap tagging paradigm. We customized JOSM to display icons denoting specific power features like generators, transformers and end-poles…a simple change with dramatic effect. And then we used the system to capture the data we needed as we trained PLN on its use. While in Indonesia, we even made time to step on a few sea-urchins, get treated at a local health-clinic, surf some incredible waves (including an off-shore reef), scuba-dive some fantastic water and simply experience a beautiful country and culture.
Results
Alongside PLN staff, we captured over 700km of medium-voltage line data and more than 1000 power equipment nodes in under 6 days of work. We integrated another 6300km of medium-voltage line data from other sources into a cohesive network that can now be added to or corrected by PLN. From this repository we can export a subset of the power network and feed it into NetworkPlanner to create a plan based on fresh data. In the course of meeting our original objective of defining a system for network data acquisition, we enhanced our entire electrification planning process.
In other words, we tamed Frankenstein with Fire and Motion and cleared our plate of Cartographic Spaghetti with a Fork 😉